This topic describes available report types.
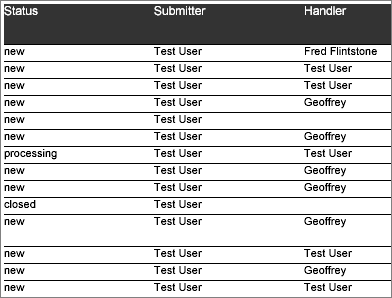
Shows the list of subtasks of the current task in the form of a list. Tasks, bug notes, task fields and messages are displayed according to the filter settings.

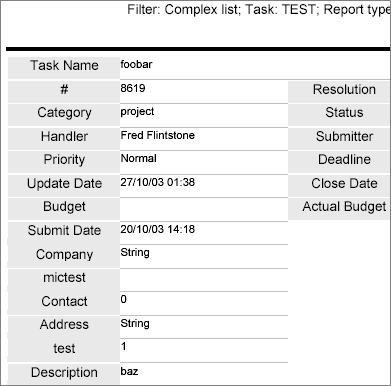
Shows all the information about subtasks of the current task. The lists of subtasks as well as the messages are displayed according to the filter settings.

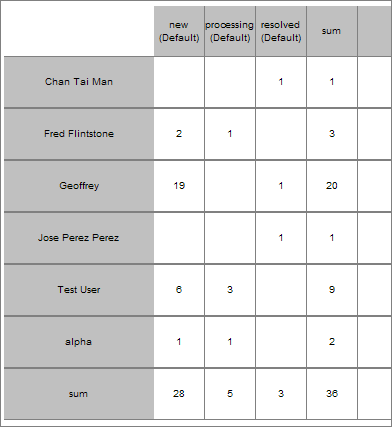
Allows statistical analysis of the data distribution. To design this kind of report, you must specify what data should be displayed on the X and Y axes, which parameter should represent the data and which function should be calculated for the selected parameter.
The parameters of the X and Y axes can be any parameters having a fixed quantity of values, including custom fields of the list type. Data can be any numeric field, including custom fields of the Integer and Double types. Note that not every possible parameter combination can make sense.

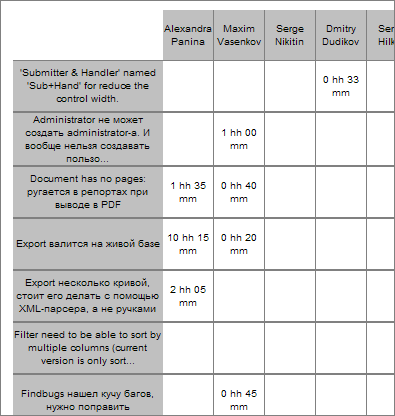
Lets you gather information on the intensity of working with subtasks of the current task. Using filter, you can specify the filtering conditions for tasks or messages. For example, you can specify a period of time that you are interested in getting information about. A report constitutes a table where the developers are placed along the X axis while subtasks of the current task are displayed along the Y axis (if the filter has the deep search option on, subtasks of the current task are also displayed).
In the cells of the table you can see the information about how many hours a certain developer devoted to the current task during the period of time specified in the filter.

 Description